


Grower’s Spectrum Cheat Sheet: Key Wavelengths to Boost Yield
Abstract: Light is the only energy input in plant growth that can be precisely controlled. Based on research data from international academic journals between 2021 and 2026, this article systematically reviews how three high-value crops—cannabis/industrial hemp, tomatoes, and strawberries—respond to key wavelengths such as red light, far-red light, UV-A, and blue-green light. It reveals how stage-specific spectral strategies can increase yields by 16%–44%. We aim to show through data that spectral adjustment is not mysticism, but a yield-enhancing map that can be followed step by step.
Target audience: indoor farm operators, greenhouse cultivation technical managers, horticultural lighting procurement decision-makers
Estimated reading time: 20 minutes
Introduction: Why is your yield still lagging even though your lights are bright enough?
You’ve probably encountered this situation: your lighting power isn’t low, PPFD measurements meet the standard, electricity costs remain high, yet your yield is always about 20% short. The problem often lies in the “spectral structure.”
Photosynthetically Active Radiation (PAR, 400–700 nm) only defines whether photons can drive photosynthesis, but does not distinguish the different effects of wavelengths on plant morphology, flowering time, and secondary metabolism. What truly determines the upper limit of yield is providing the right “extra wavelengths” at critical stages.
We reviewed authoritative studies published in journals such as Frontiers in Plant Science and Nature Scientific Reports in recent years, and identified three cross-crop spectral yield-enhancement principles:
1. Add red light during vegetative growth → more branching and more fruiting sites
2. Add far-red light during flowering and fruit set → faster fruit maturation and increased individual fruit weight
3. Add UV-A during fruit maturation → increased secondary metabolites (cannabinoids, anthocyanins, flavonoids, etc.)
Next, we will analyze each crop in depth and present the data.
Chapter 1: Cannabis/Industrial Hemp — Red Light Builds Structure, UV-A Fills Content
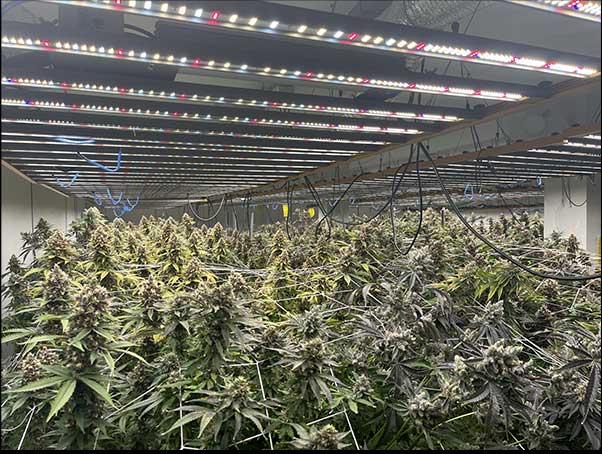
Image 1.1 Indoor Cannabis Farm
1.1 Nature sub-journal 2025 study: Stage-specific spectral strategy increases CBD yield by 44%
This is one of the most practically valuable studies on LED light environment regulation for cannabis.
An Italian research team used a high-CBD industrial hemp variety and set up four treatments:
Treatment group | Vegetative stage | Reproductive stage |
VWRW (control) | White light | White light |
VWRRW | White light + red light | White light |
VWRWUV | White light | White light + UV-A |
VWRRWUV | White light + red light | White light + UV-A |
Key findings:
• In the VWRRW group with red light supplementation during vegetative growth, effective branch number increased by 18.0%, and inflorescence dry weight increased by 17.9% (p<0.05).
• In the VWRWUV group with UV-A supplementation during flowering, CBG content increased by 52.7% and CBD by 12.1%.
• The combined VWRRWUV group performed best: CBD yield per plant reached 4.62 g (+44.1%), and CBG yield increased by 91.8%.
What does this mean? Red light “builds the structure”—allowing more fruiting branches; UV-A “fills the content”—stimulating biosynthesis of active compounds in inflorescences. Their stage-specific synergy creates a significant additive effect. However, it should be noted that CBD yield differences among the three treatment groups (VWRRW, VWRWUV, VWRRWUV) were not significant, suggesting overlapping pathways in red light and UV-A effects on CBD.
1.2 Frontiers review: Why does UV stimulate cannabinoid accumulation?
This phenomenon has a deeper biological explanation.
A key review in Frontiers in Plant Science points out that cannabis secondary metabolites—cannabinoids and terpenes—evolved as “sunscreen” to protect against UV radiation.
Mechanism: key enzymes in cannabinoid biosynthesis—DXS, IPPi, and GPPS—are upregulated by UV and blue light (confirmed in aromatic plants like mint). Moderate UV stress “triggers” plants to synthesize more protective compounds, which happen to be valuable medicinal substances such as THC, CBD, CBG, and terpenes.
But an important warning: UV dosage is not “the more the better.”
A Humboldt University Berlin study quantified this. At a UVA:UVB ratio of 67:33 and UV intensity of 4.2 W/m², leaves curled within three days and developed necrotic spots by day four. At a ratio of 99:1 and intensity of 1.81 W/m², no leaf damage occurred, and terpene levels increased—linalool (+29%), limonene (+25%), myrcene (+22%).
Practical guideline: For cannabis/industrial hemp, use sufficient red light during vegetative growth (600–700 nm ≥40%) to promote branching. During reproductive growth, introduce mild UV-A (peak ~390 nm, UVA:UVB ≥99:1, total UV intensity 1.5–2.0 W/m²) to maximize secondary metabolite accumulation without damaging leaves. Start with 4–6 hours of UV exposure per day and gradually adapt.
1.3 Variables your spectrum strategy must consider
A professional lighting recipe must also account for: variety (high CBD vs high THC vs balanced), stage transition timing, base PPFD level, CO₂ concentration, etc. This is why fixed “one-size-fits-all” spectrum lights often achieve only about 70% of theoretical yield potential.
Chapter 2: Tomatoes — The Unavoidable Far-Red Light: The Key to a 16% Yield Increase
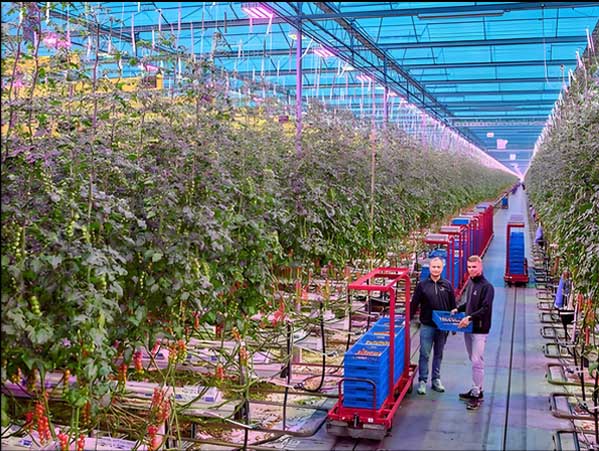
Picture 2.1 Tomato Glass Greenhouse
2.1 Wageningen University 2025 study: Dose-response curve of far-red ratio
If UV-A is key for cannabis, far-red light (FR, 700–800 nm) is the key for tomatoes.
A July 2025 study from Wageningen University provides the most precise dose-response analysis of far-red supplementation.
At a base PPFD of 250 µmol/m²/s, six far-red ratios (0.22–0.49) were tested on two tomato varieties over 20 weeks.
Core findings:
• Increasing far-red ratio from 0.22 to 0.40 linearly increased yield up to +16%
• Beyond 0.40 (0.44–0.49), yield gains plateaued or declined
• Yield increase was driven by total biomass increase and higher dry matter allocation to fruit
• Radiation and energy use efficiency declined when ratio ≥0.44
Conclusion: Far-red is not better in excess. There is a clear optimum at FR/(R+FR) ≈ 0.40.
2.2 Synergy of other wavelengths
Another study published in 2026 supplemented this with more wavelength information. Comparative experiments using red and blue light as a base (RB), with the addition of red, blue, green, far-red, and UV-A light respectively, showed that:
Spectrum treatment | Effect |
RB + R(Enhance red light) | Large fruit count +25.79%, yield +6.94% |
RB + G(Add green light) | Single fruit weight +8.29%, highest sugar content |
RB + FR(Add far-red light) | Improved protein, amino acids, sugar-acid ratio |
RB + UVA | Promotes height growth; improves protein and organic acids |
The unique value of green light deserves attention., often considered “inefficient,” actually penetrates canopy layers and improves whole-plant photosynthesis.
Practical guideline: Use red-blue base light with FR/(R+FR)=0.35–0.40. Add 10–15% green light for better fruit weight and sweetness.
2.3 Mechanism of far-red yield increase
The reason why far-red light can increase yield is related to the plant's phytochrome system. Far-red light converts the active form of Pfr into the inactive form of Pr, altering the light homeostasis of phytochromes and triggering a "shade avoidance response"—the plant "senses" the presence of competing vegetation (the proportion of far-red light increases after being filtered by the leaves), and thus allocates more assimilated products to the harvest organ (fruit). Moderately utilizing this response is equivalent to gently "tricking" the crop into investing more resources in the fruit.
Chapter 3: Strawberries — Full-spectrum control from flowering to quality
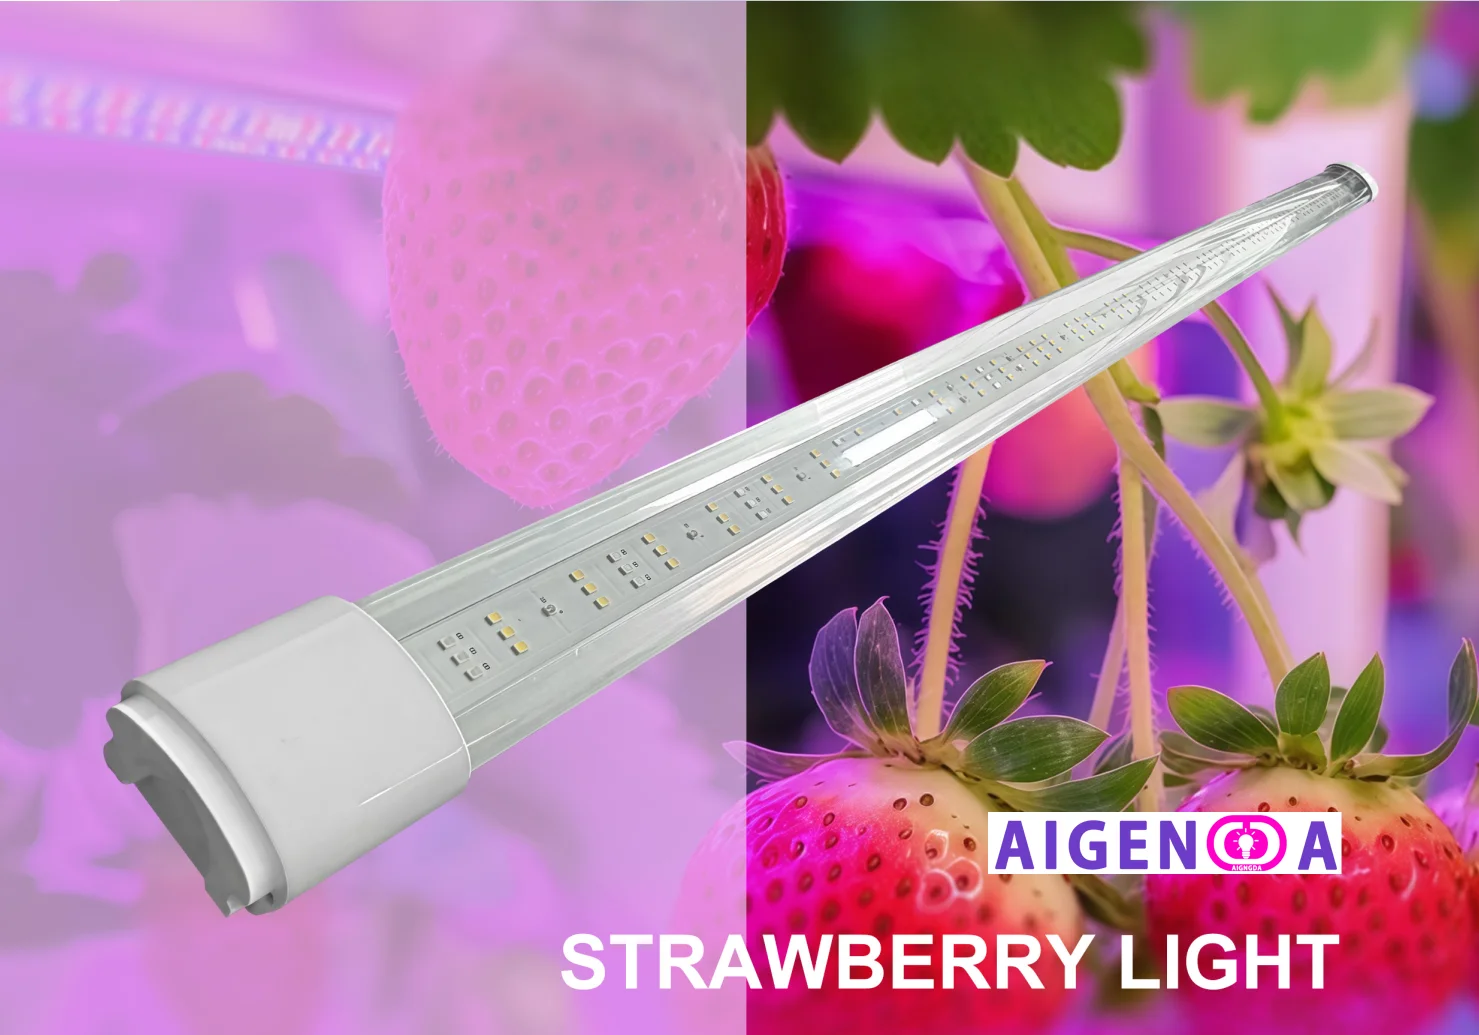
Picture 3.1 Grow lights for Strawberry
3.1 Far-red: A double-edged sword for flowering
Strawberries are highly sensitive to photoperiod, and far-red light plays a central role in flower bud differentiation.
A 2025 study published in Hort Technology tested different timings of far-red light application on the June-fruiting strawberry variety ‘Keepsake’:
Treatment | FR timing | Effect |
FR++ | Entire cycle | Earlier flowering, smaller fruit |
FR+ − | Early stage only | Reduced leaf area, shorter roots |
FR− + | Late stage only | Larger fruit, no negative effects;Early loss of Ca and Mg was relatively small. |
Conclusion: Delay FR application to avoid early stress effects.
3.2 Blue light and UVA: Balancing yield and quality
A 2025 study on greenhouse strawberry light conversion films offered another perspective.
Researchers used two types of light conversion films: a blue film (converting UV to blue light) and a pink film (converting UV and green light to blue + red light).
• Under the blue film treatment: net photosynthetic rate increased by 9%, stomatal conductance increased by 11%, and fruit yield increased by 34% compared to the control.
• The blue film reduced the incidence of postharvest gray mold (Botrytis cinerea) by 37% (72 hours after inoculation).
• The pink film did not significantly increase yield, but increased soluble solids by 30% and ascorbic acid by 29%.
This again illustrates that blue light focuses on yield and disease resistance; red-blue combined light focuses on quality. The priority of objectives determines the choice of spectrum.
3.3 Secondary metabolism control
A special review article in Frontiers in Plant Science outlines the relationship between strawberry photobiology and flavonoid accumulation:
• Anthocyanins (which determine the red color of strawberries) accumulate rapidly in the late stages of fruit ripening, increasing more than tenfold from the white fruit stage to the red fruit stage.
• Both UV-B (280–315 nm) and visible light can stimulate anthocyanin accumulation, but the mechanisms differ: UV-B induces the synthesis of protective pigments via the UVR8 receptor; blue-green light, on the other hand, stimulates anthocyanin accumulation through the cryptochrome and phytochrome pathways.
• Flavonols (quercetin, kaempferol) are more sensitive to UV-B; their accumulation is significantly reduced under shading treatment, leading to a decrease in the fruit's antioxidant value.
Guideline: Add mild UV in late stage; keep blue light at 20–30%.
3.4 General principle: Secondary metabolism = response to mild stress
Therefore, moderate UV radiation is a "survival challenge" for plants, which use synthetic secondary metabolites as a "chemical shield." These secondary metabolites are precisely the valuable substances humans seek—cannabinoids, anthocyanins, flavonoids, and antioxidants. This is why mastering UV dosage and spectral ratios is equivalent to mastering the control knob for economic value.
Chapter 4: Cross-crop spectral principles
4.1 Three golden rules:
Reviewing the research data from the three crops mentioned above, we can extract three cross-crop spectral management principles:
Principle 1: Use red light to drive the vegetative growth stage.
Red light (600–700 nm) promotes photosynthetic efficiency, increases branching number, and provides effective fruiting sites. Hemp research shows that red light increases branching number by 18%, and in tomato experiments, enhanced red light increased the number of large fruits by 25.79%—both are building the "skeleton" for high yields.
Principle 2: Use far-red light to regulate distribution during flowering and fruit setting.
Far-red light (700–800 nm) transmits a "moderate competition" signal to plants by altering the light homeostasis of phytochromes, prompting more assimilates to be allocated to harvest organs. This is the core mechanism behind the 16% increase in tomato yield. However, precise control of timing and proportion is crucial—excessive or premature application can have adverse effects.
Principle 3: Use UV light to stimulate defensive metabolism during the quality formation stage.
UVA/UVB at appropriate doses triggers secondary metabolic pathways in plants, increasing the content of functional components such as cannabinoids, anthocyanins, and flavonoids. The key lies in dose control: a high proportion of UVA (≥99%) combined with a low total dose (approximately 1.8 W/m²) is the commercially available range confirmed by current research.
4.2 Stage-based spectrum switching
4.2 Phased Spectral Switching: A Core Advantage in the LED Era
Traditional HPS lighting fixtures cannot flexibly adjust the spectrum, while the advent of LEDs makes phased spectral management a reality. This presents a technological window for professional growers to establish a competitive advantage.
A typical commercial spectral scheme should include:
1. Vegetative growth stage: High proportion of red light (R:B ≈ 4:1 to 6:1), with moderate addition of far-red light to regulate plant shape.
2. Early flowering/fruit set stage: Increase the proportion of far-red light to FR/(R+FR) ≈ 0.35–0.40, maintaining high PPFD.
3. Early maturity/harvest stage: Introduce UV-A irradiation (daily dose approximately 80–120 kJ/m²), reducing or discontinuing far-red light to avoid excessive vegetative growth.
This scheme is not a theoretical deduction, but an executable plan based on the above-mentioned peer-reviewed studies.
Chapter 5: From research to application
5.1 Limitations of “full-spectrum” lights
Currently, most mainstream LED plant lights on the market use a fixed spectrum—manufacturers pre-set a "one-size-fits-all" formula, attempting to suit all crops and all growth stages. However, the aforementioned research clearly shows that cannabis requires UV-A, tomatoes need a precise ratio of far-red light, and strawberries require staged adjustments to the blue light ratio—there is no "perfect spectrum" applicable to all crops.
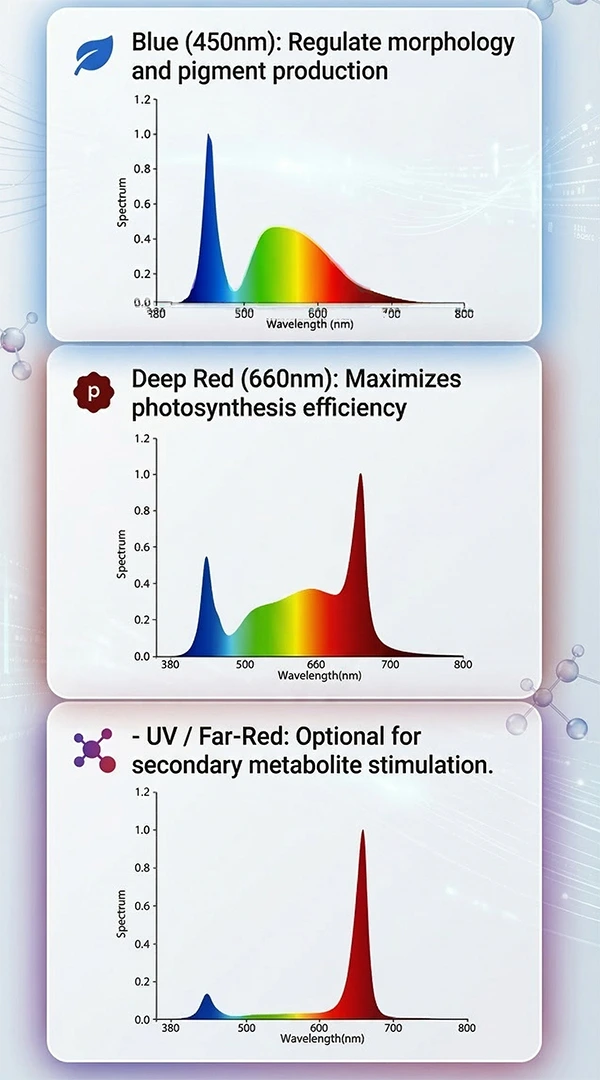
Image 5.1 Common Grow lights Spectra
Another hidden danger of low-cost fixed-spectrum lights is insufficient spectral precision. For example, the actual peak of deep red light labeled 660 nm may drift between 645–670 nm; and the response precision requirements of plant phytochromes to 660 nm and 730 nm are far higher than the range of human eye perception.
5.2 What manufacturers provide: Spectral Solutions from OEM to ODM
As a source factory specializing in the R&D and manufacturing of plant lights, our core problem is translating cutting-edge academic research into scalable spectral solutions.
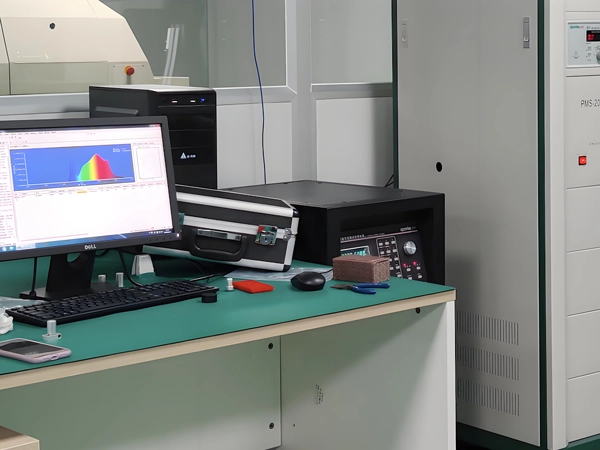
Image 5.2 Spectral analysis equipment
Specifically, we offer differentiated services at three levels:
① Customized Spectrum Services
Based on your main plant varieties and planting goals, our engineering team customizes LED chip ratios. This includes, but is not limited to: the basic red-blue light ratio, the proportion of 660 nm deep red light, the amount of 730 nm far-red light added, UVA wavelength selection (385/395/405 nm), and whether green light components are needed.
② Staged Dimming Solutions
We provide a multi-channel independent dimming control system, supporting one-click switching of spectral formulas across the three stages of vegetative growth, flowering, and maturity. The lighting hardware itself has reserved independent UV and FR channels, allowing users to flexibly program the spectrum according to the crop cycle.
③ Third-Party Laboratory Spectral Validation
We can provide an integrating sphere spectral measurement report for each batch of customized lights, verifying key parameters such as peak wavelength, full width at half maximum (FWHM), and PPFD for each band, ensuring compliance with the technical specifications agreed upon with you and your clients.
5.3 How to Initiate a Consultation
If you would like to discuss spectral solutions for a specific crop, please provide the following information. We will respond with preliminary spectral configuration suggestions and a reference quote within one week:
• Target crop and variety name
• Planting method (vertical racking/greenhouse/indoor greenhouse)
• Current light source type and main problems encountered
• Desired yield or quality improvement goals
Contact: [https://www.aigengda.com/, Leon@aigengda.com]
Conclusion: Spectroscopy is not mysticism, it's data
This article has cited experimental data from 8 academic papers, not to appear "academic," but to express an attitude: plant light environment regulation has moved from empiricism to a data-driven stage. A 16%–44% increase in crop yield is not an exaggeration, but a replicable result under controlled conditions.
As a source manufacturer, we don't simply "sell a light," but provide every professional grower with spectral solutions that can withstand data scrutiny. After all, every penny you pay for electricity should translate into visible yield and quality.
References
Hawley, D. et al. (2021). Cannabinoids and Terpenes: How Production of Photo-Protectants Can Be Manipulated to Enhance Cannabis sativa L. Phytochemistry. Frontiers in Plant Science, 12, 620021. https://www.frontiersin.org/journals/plant-science/articles/10.3389/fpls.2021.620021/full
Vincenzi, E. et al. (2025). Dose-response of tomato fruit yield to far-red fraction in supplementary lighting. Frontiers in Plant Science, 16, 1618171. https://www.frontiersin.org/journals/plant-science/articles/10.3389/fpls.2025.1618171/full
Zhao, J. et al. (2022). A Review of Strawberry Photobiology and Fruit Flavonoids in Controlled Environments. Frontiers in Plant Science, 12, 611893. https://www.frontiersin.org/journals/plant-science/articles/10.3389/fpls.2021.611893/full
(2025). Timing of Far-red Light Exposure Influences Growth, Fruit Quality, and Nutrient Uptake in June-bearing Strawberry. HortTechnology, 35(3), 370–376. https://journals.ashs.org/view/journals/horttech/35/3/article-p370.xml
Vincenzi, E. et al. (2025). Combination of red and UV-A light enhances hemp (Cannabis sativa L.) inflorescence yield and cannabinoid content. Scientific Reports. https://www.nature.com/articles/s41598-025-28292-z
Sun, D. et al. (2026). Effects of supplementary lighting with different spectral compositions on plant growth, fruit development, and quality formation of facility-grown tomatoes. Scientific Reports. https://www.nature.com/articles/s41598-026-44021-6
El Horri, H. et al. (2025). The Influence of Solar Radiation Modulation Using Double-Roof Light Conversion Films on the Pre- and Post-Harvest Fruit Quality of Strawberry. Horticulturae, 11(9), 1121. https://ouci.dntb.gov.ua/en/works/7A51ZmE3/
Huebner, D.S. et al. (2024). UV spectral quality and intensity effects on Cannabis sativa photomorphogenesis and secondary metabolites. Frontiers in Plant Science. https://public-pages-files-2025.frontiersin.org/journals/plant-science/articles/10.3389/fpls.2024.1480876/xml
All product information in this article is subject to actual specifications. The production increase rates mentioned in this article are the results obtained under specific conditions by peer-reviewed studies, and the actual results may vary depending on variety, environment, and management factors.
-end-
